
AWS HealthImaging
2023
AWS HealthImaging is a service for developers of cloud-native medical imaging applications. HealthImaging ingests DICOM data for storage and analysis.
I was the lead designer on this project and worked on the design from inception to launch.

Application icons to explain service functionality

API description
Kick Off
The product requirements document (PRD) was light on details but there were several API descriptions to work from. Some research activities had been undertaken and I inherited a few personas that had not been vetted.
I facilitated several workshops to work on project timelines, goals, and requirements. This included:
• Story creation
• High level flow analysis
• System modeling
Unified Modeling Language - UML
My methodology uses UML extensively to quickly and accurately model the system we will be designing. UML is a modeling language consisting of integrated diagrams used for specifying, visualizing, constructing, and documenting the artifacts of the system.
Who - Use Case Diagram
Use case diagrams summarize the details of a system's users (actors) and their interactions with the system. The personas became actors and the high-level tasks that they can perform are captured in the bubbles. Use case diagrams allow all team members to agree on what is being built before a wireframe or a line of code is created.
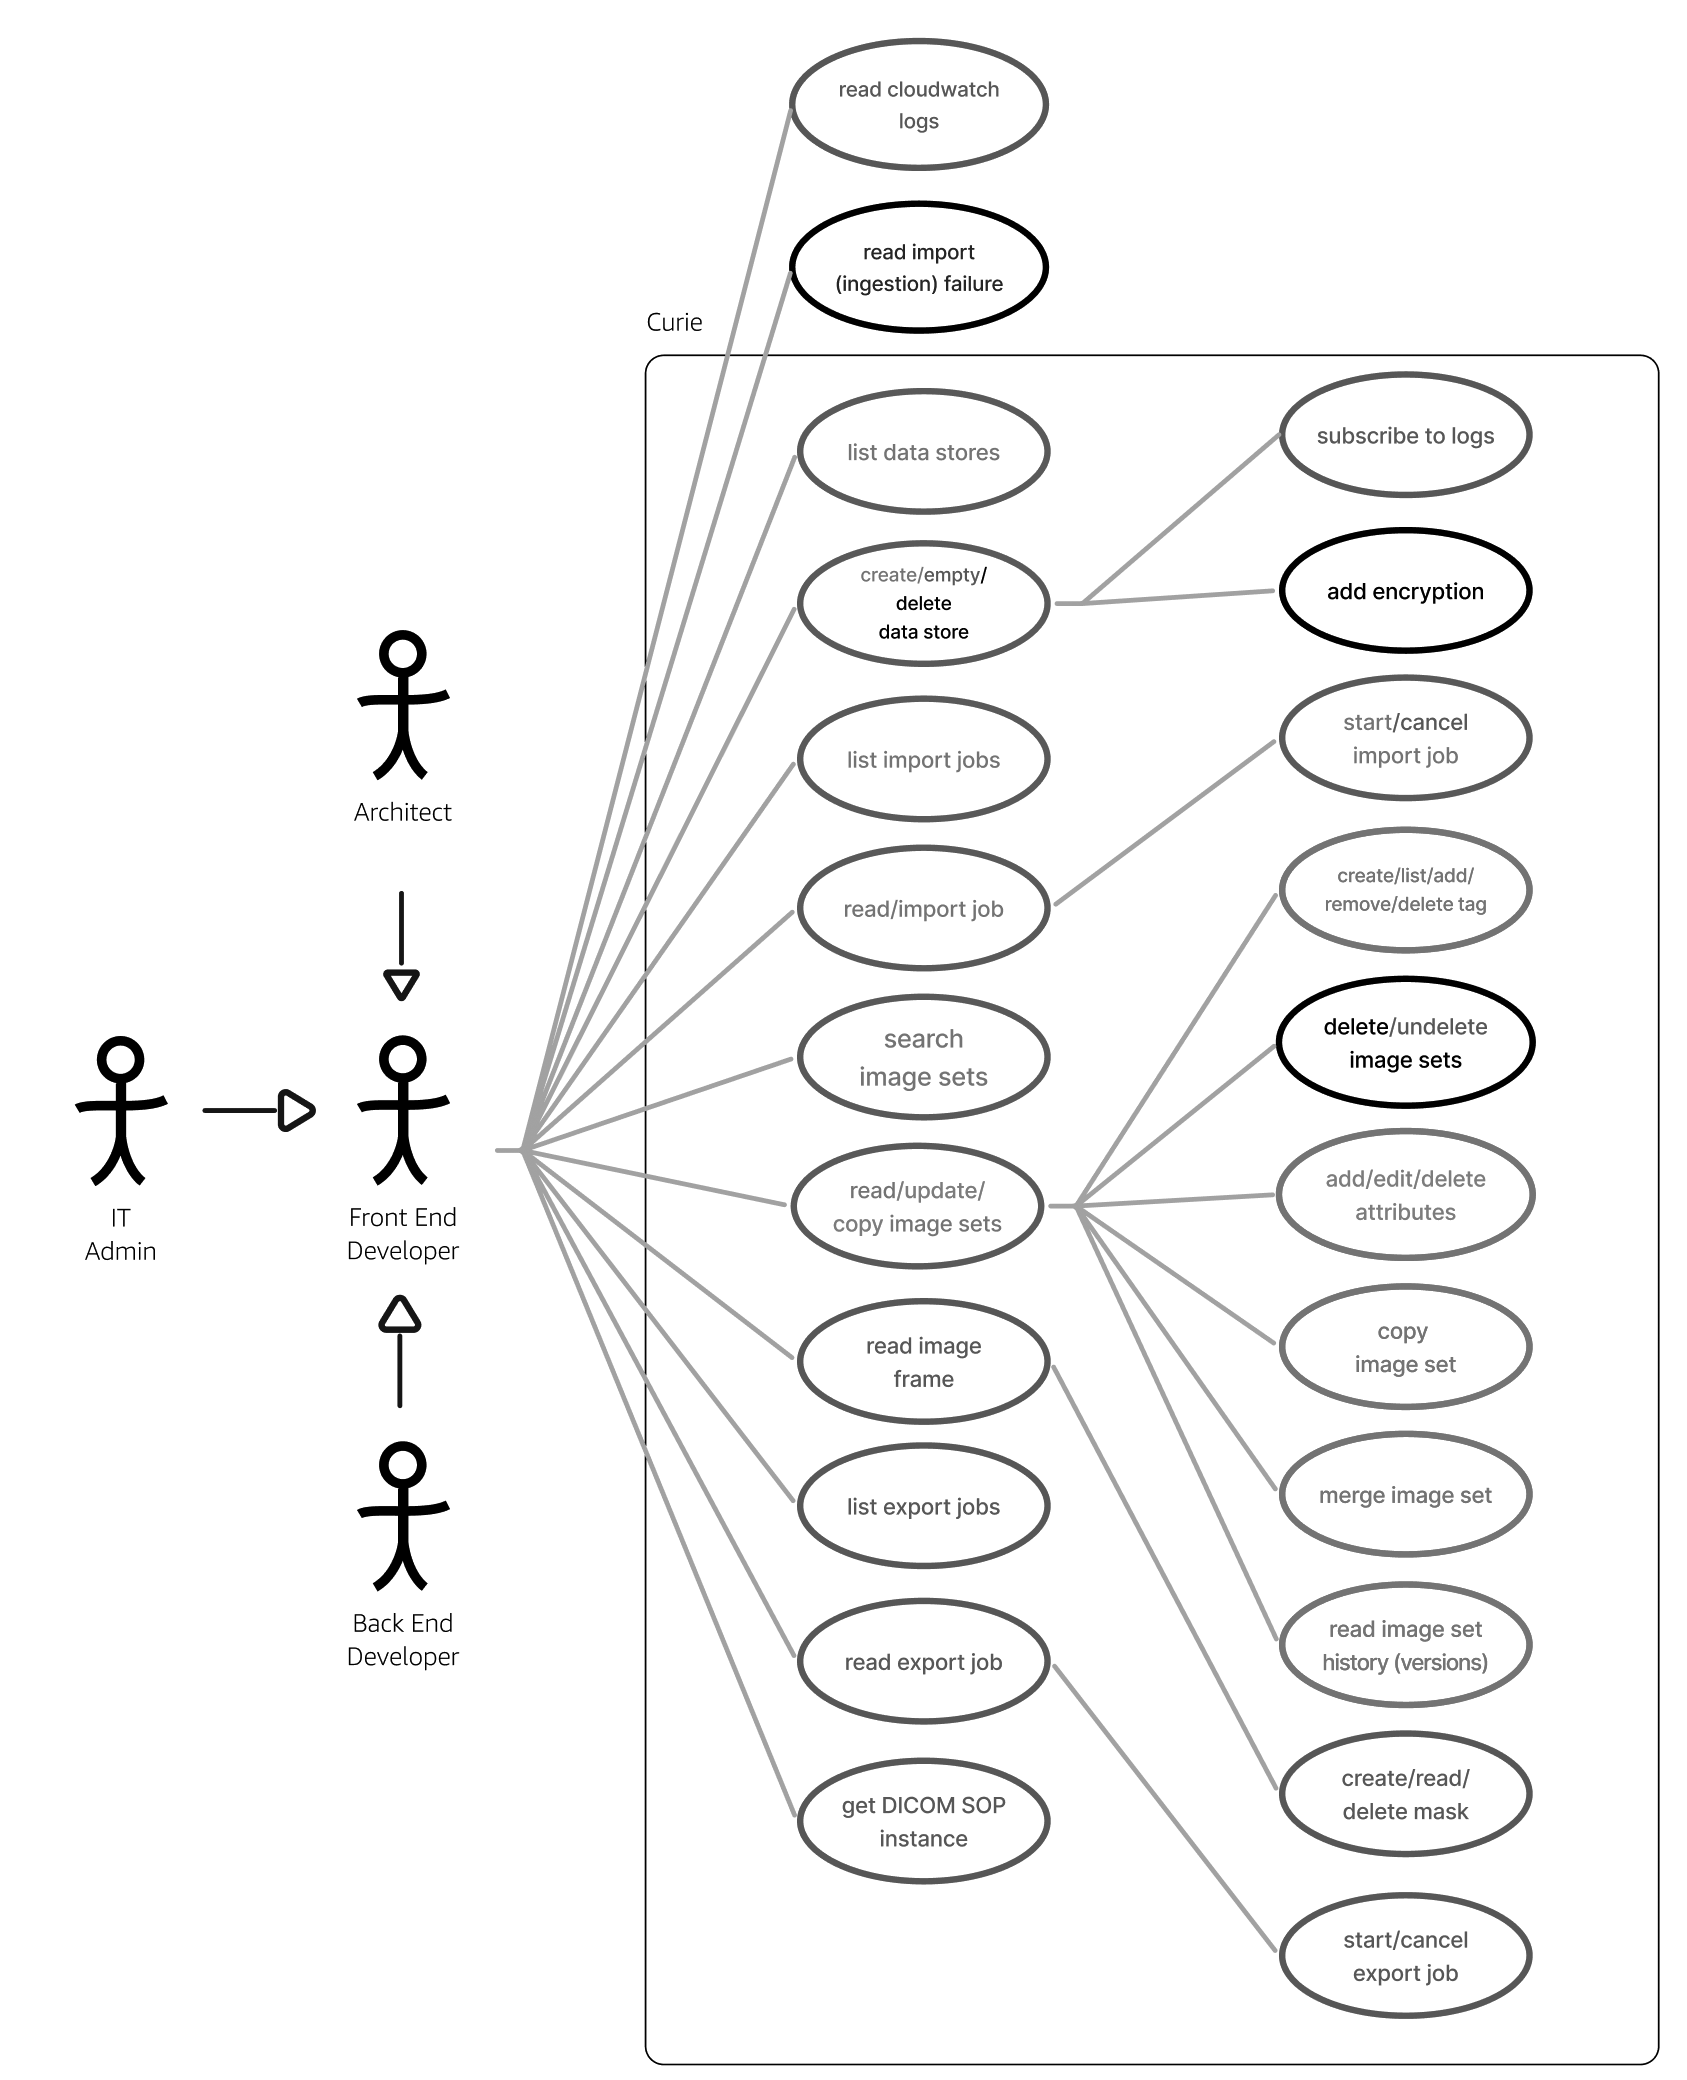
Use Case Diagram

Object Diagram
What - Object Diagram
Object diagrams show all the objects and their attributes in the system. These are the objects that the user will be interacting with in the user interface. The arrows and lines show the relationships with other objects. Some are one-to-one relationships and some are one-to-many.
When + Where
This project had multiple release dates that were constantly in flux. Color coding the use case and object diagrams to release dates allowed all team members to understand which functionality was being released and when. Strike-throughs show functionality that was removed.
These diagrams also facilitated way-finding. Links were created from these diagrams to Figma artboards and prototypes.
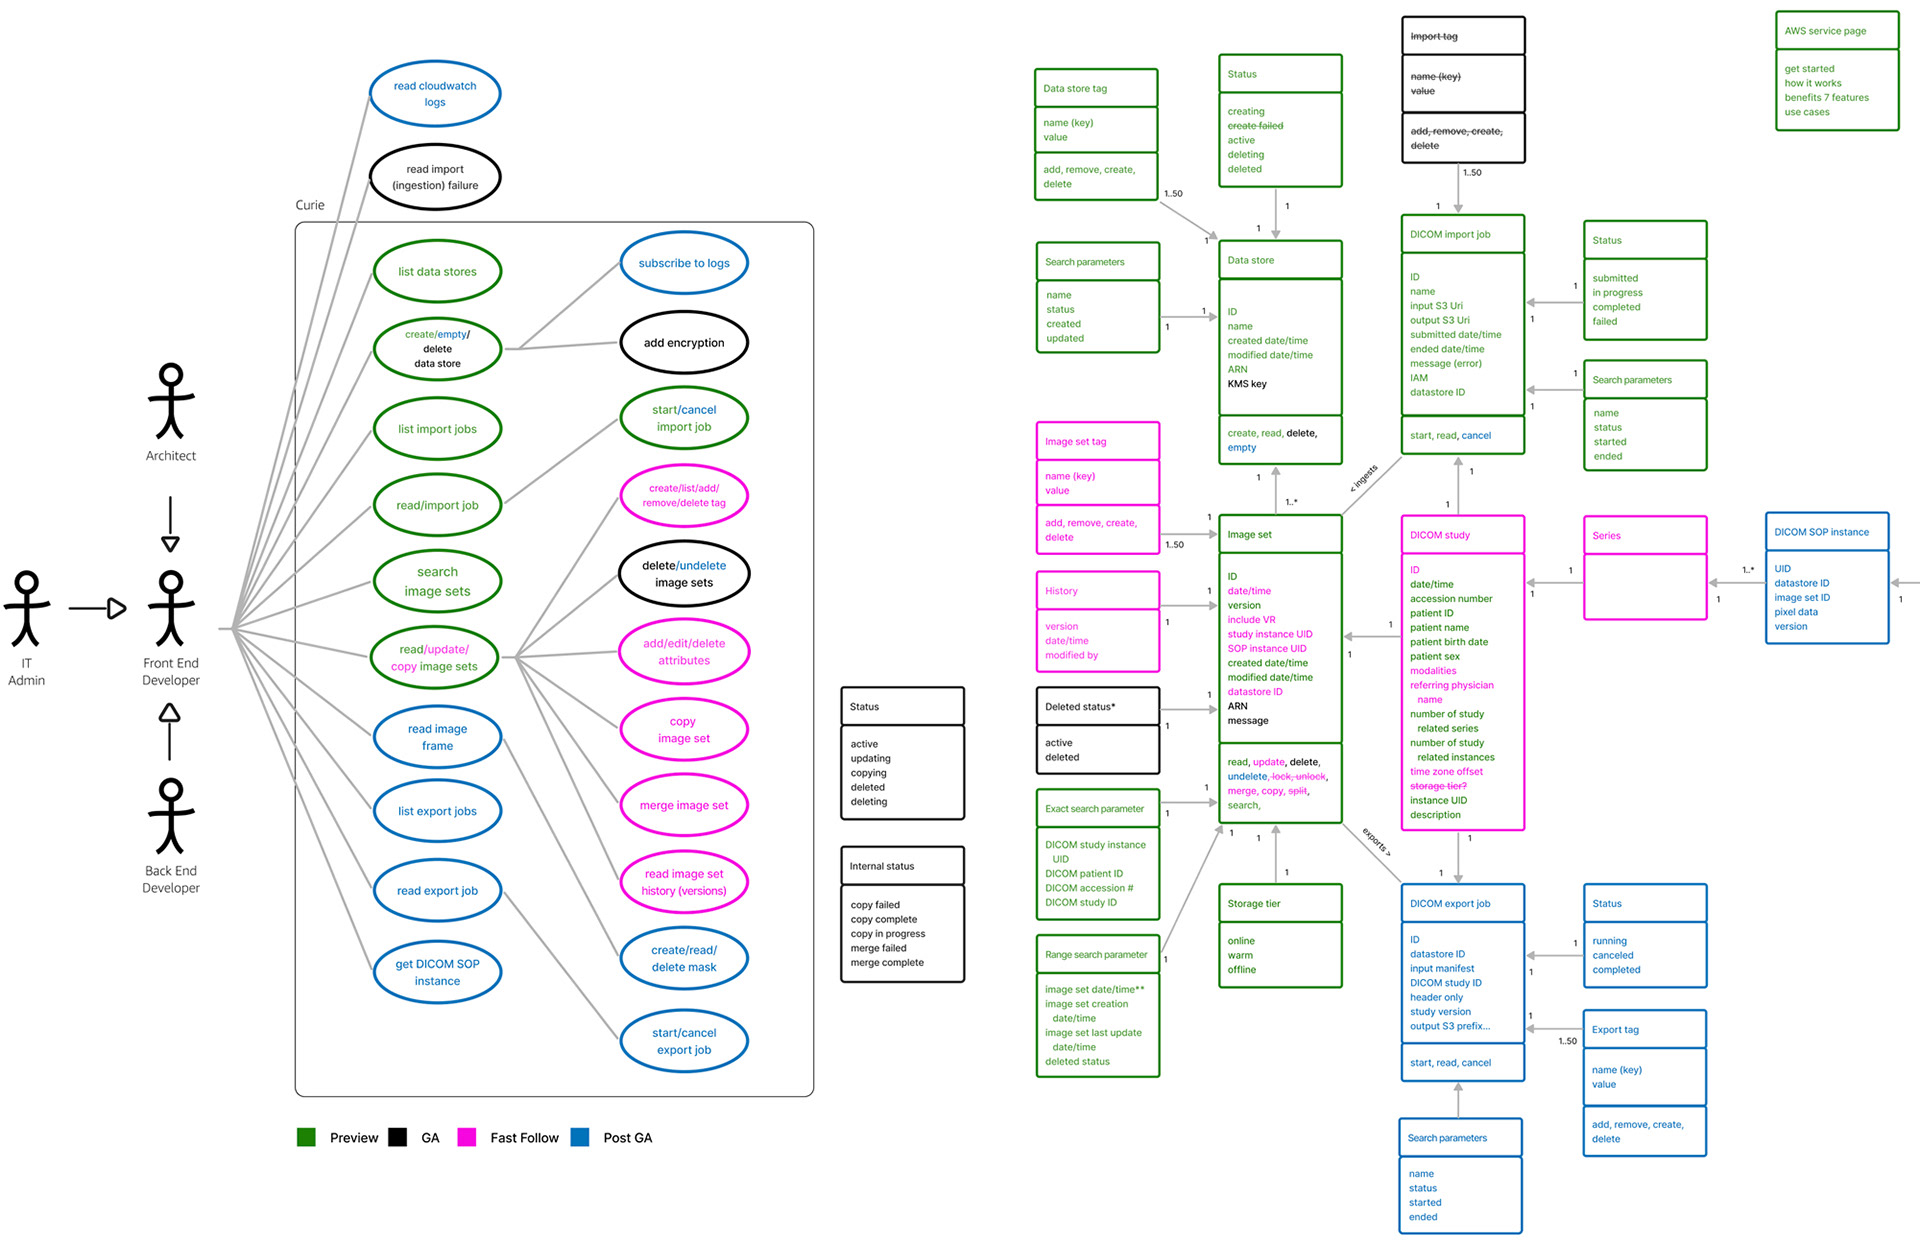
Color-coded usecase + object diagrams
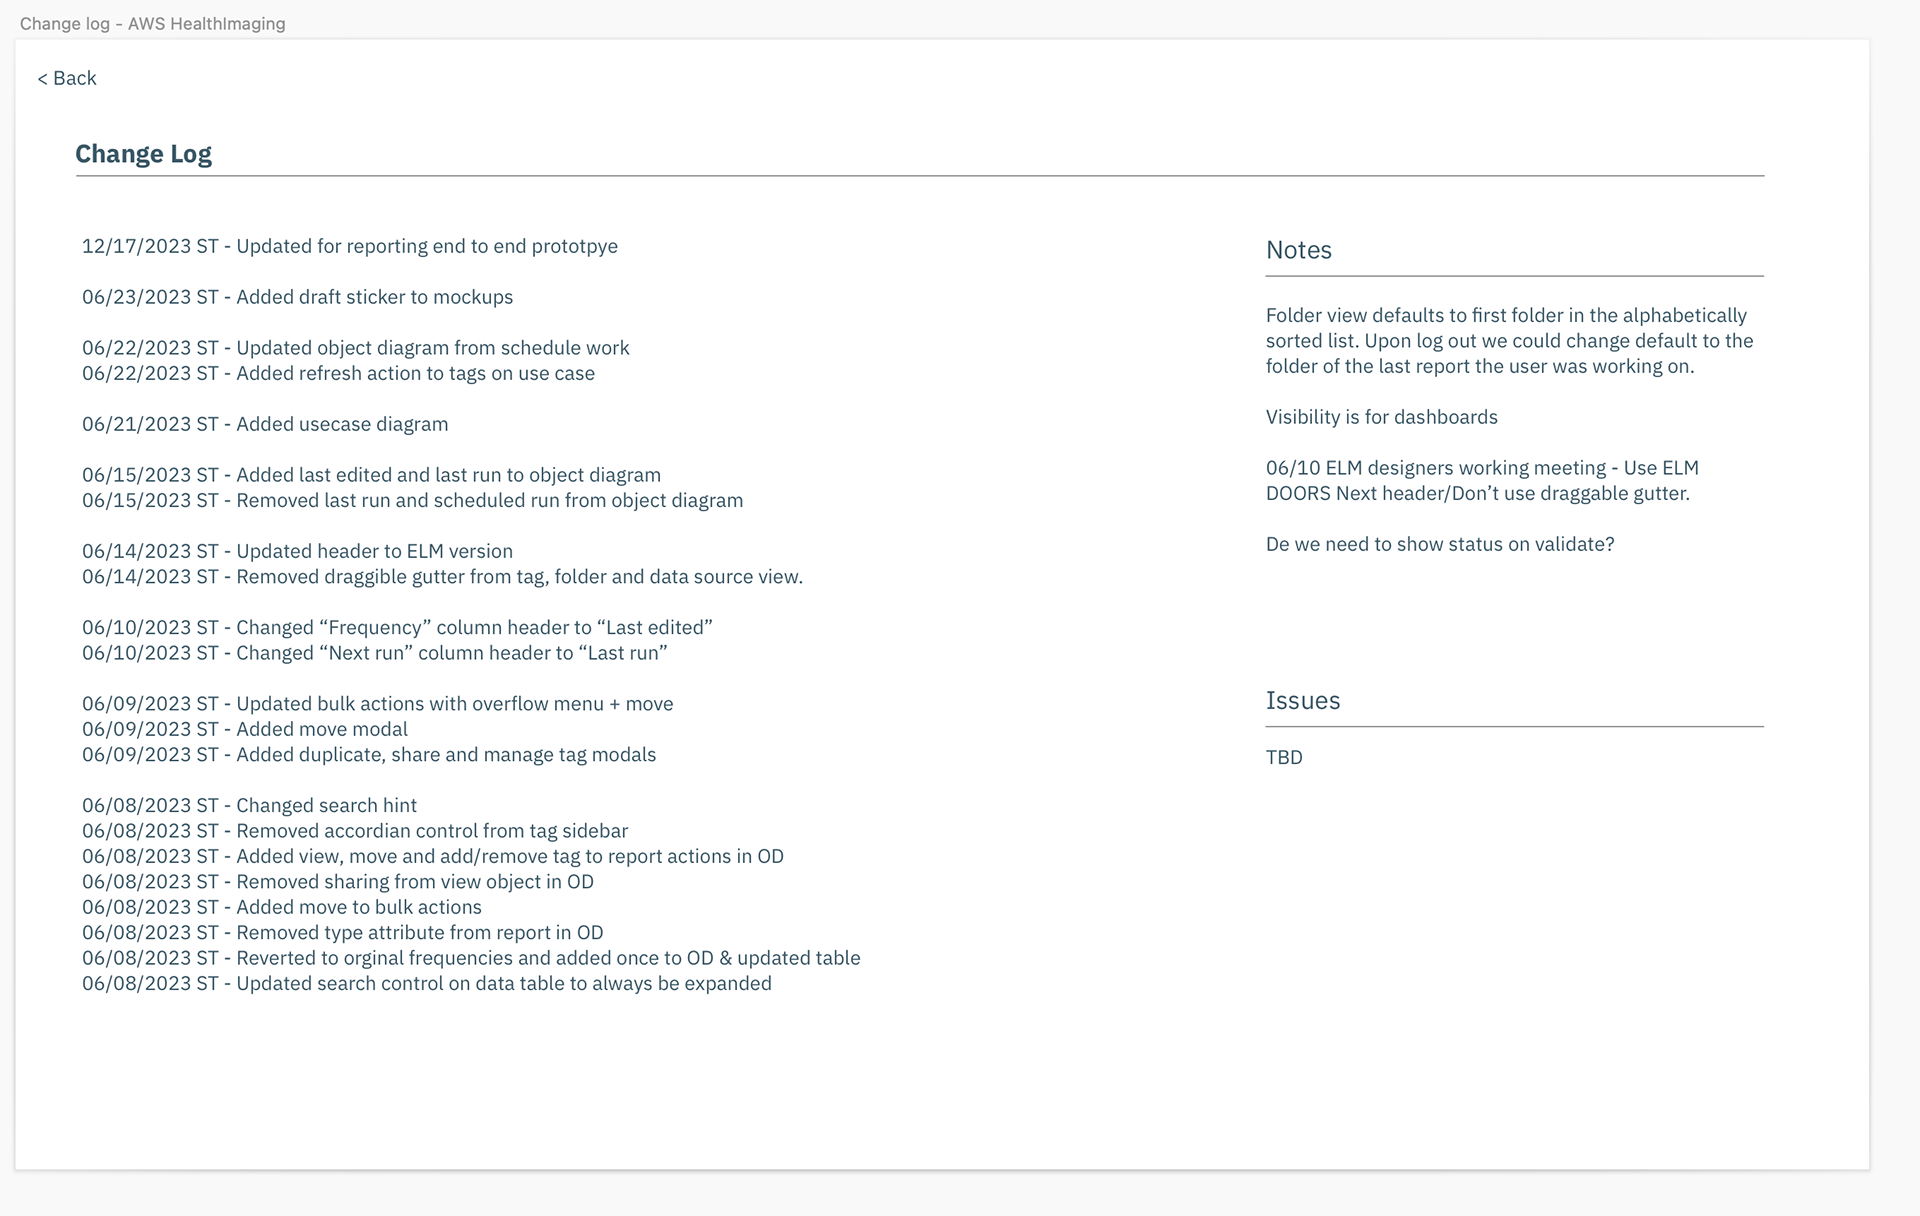
Change log
Why
During this project, we went through 5 product managers, 5 dev leads, 3 front-end developers, 3 back-end developers, and 3 designers. It was important to track changes, who made them, and why. A change log and major decisions were tracked in the Figma files.
How
Prototypes were created for reviews and user testing. Interactive interaction notes were created for development in the Figma files.

Interaction notes for development
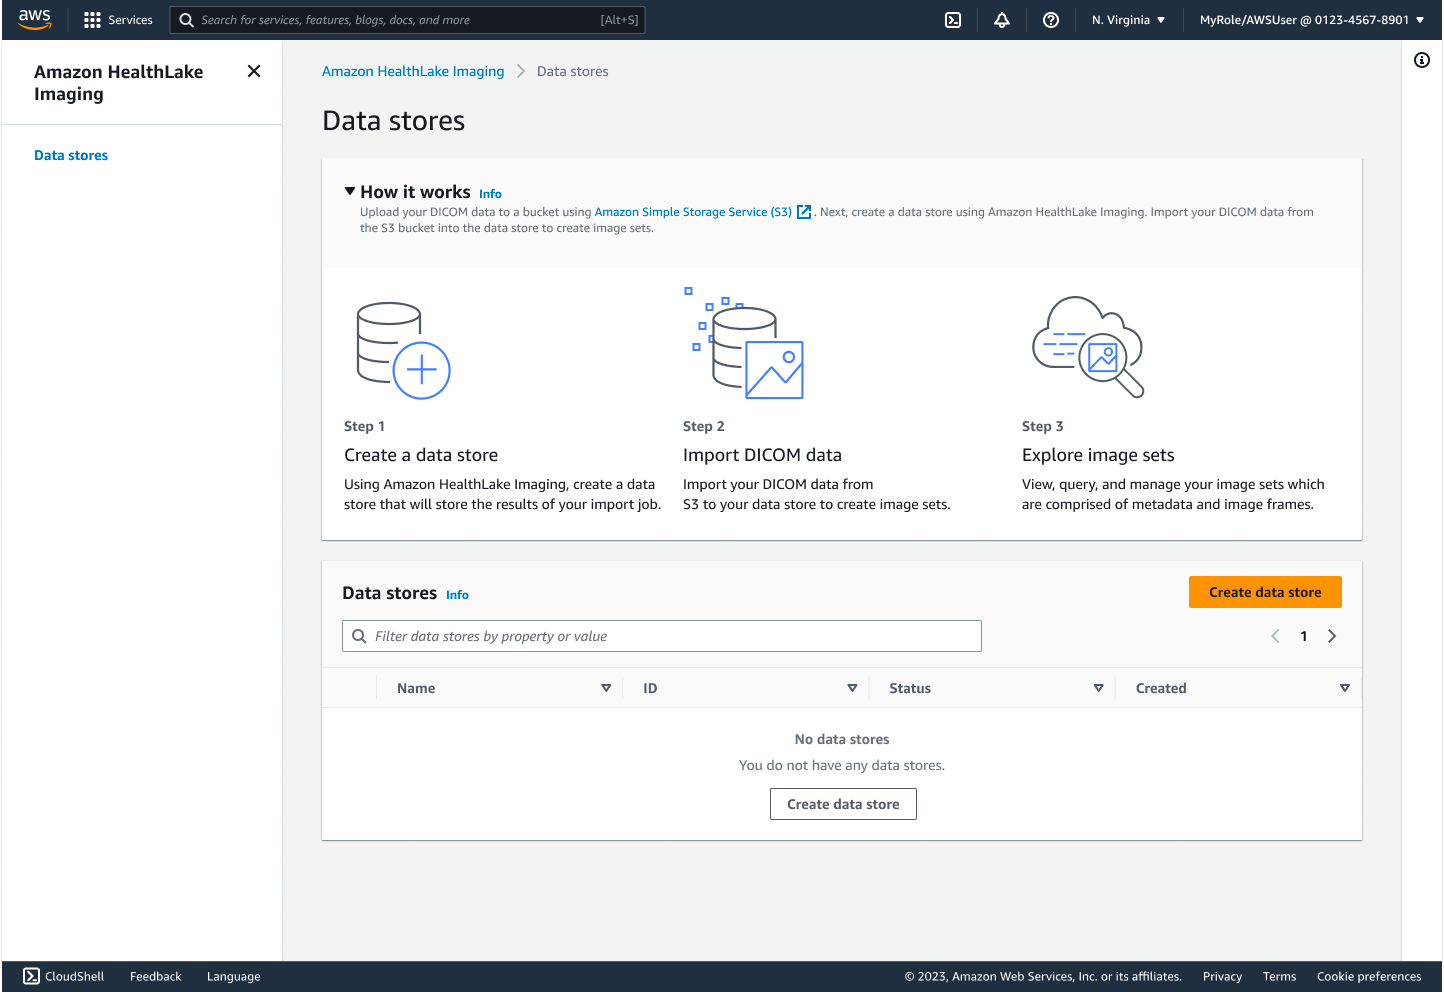
Data stores start screen that describes how the service works
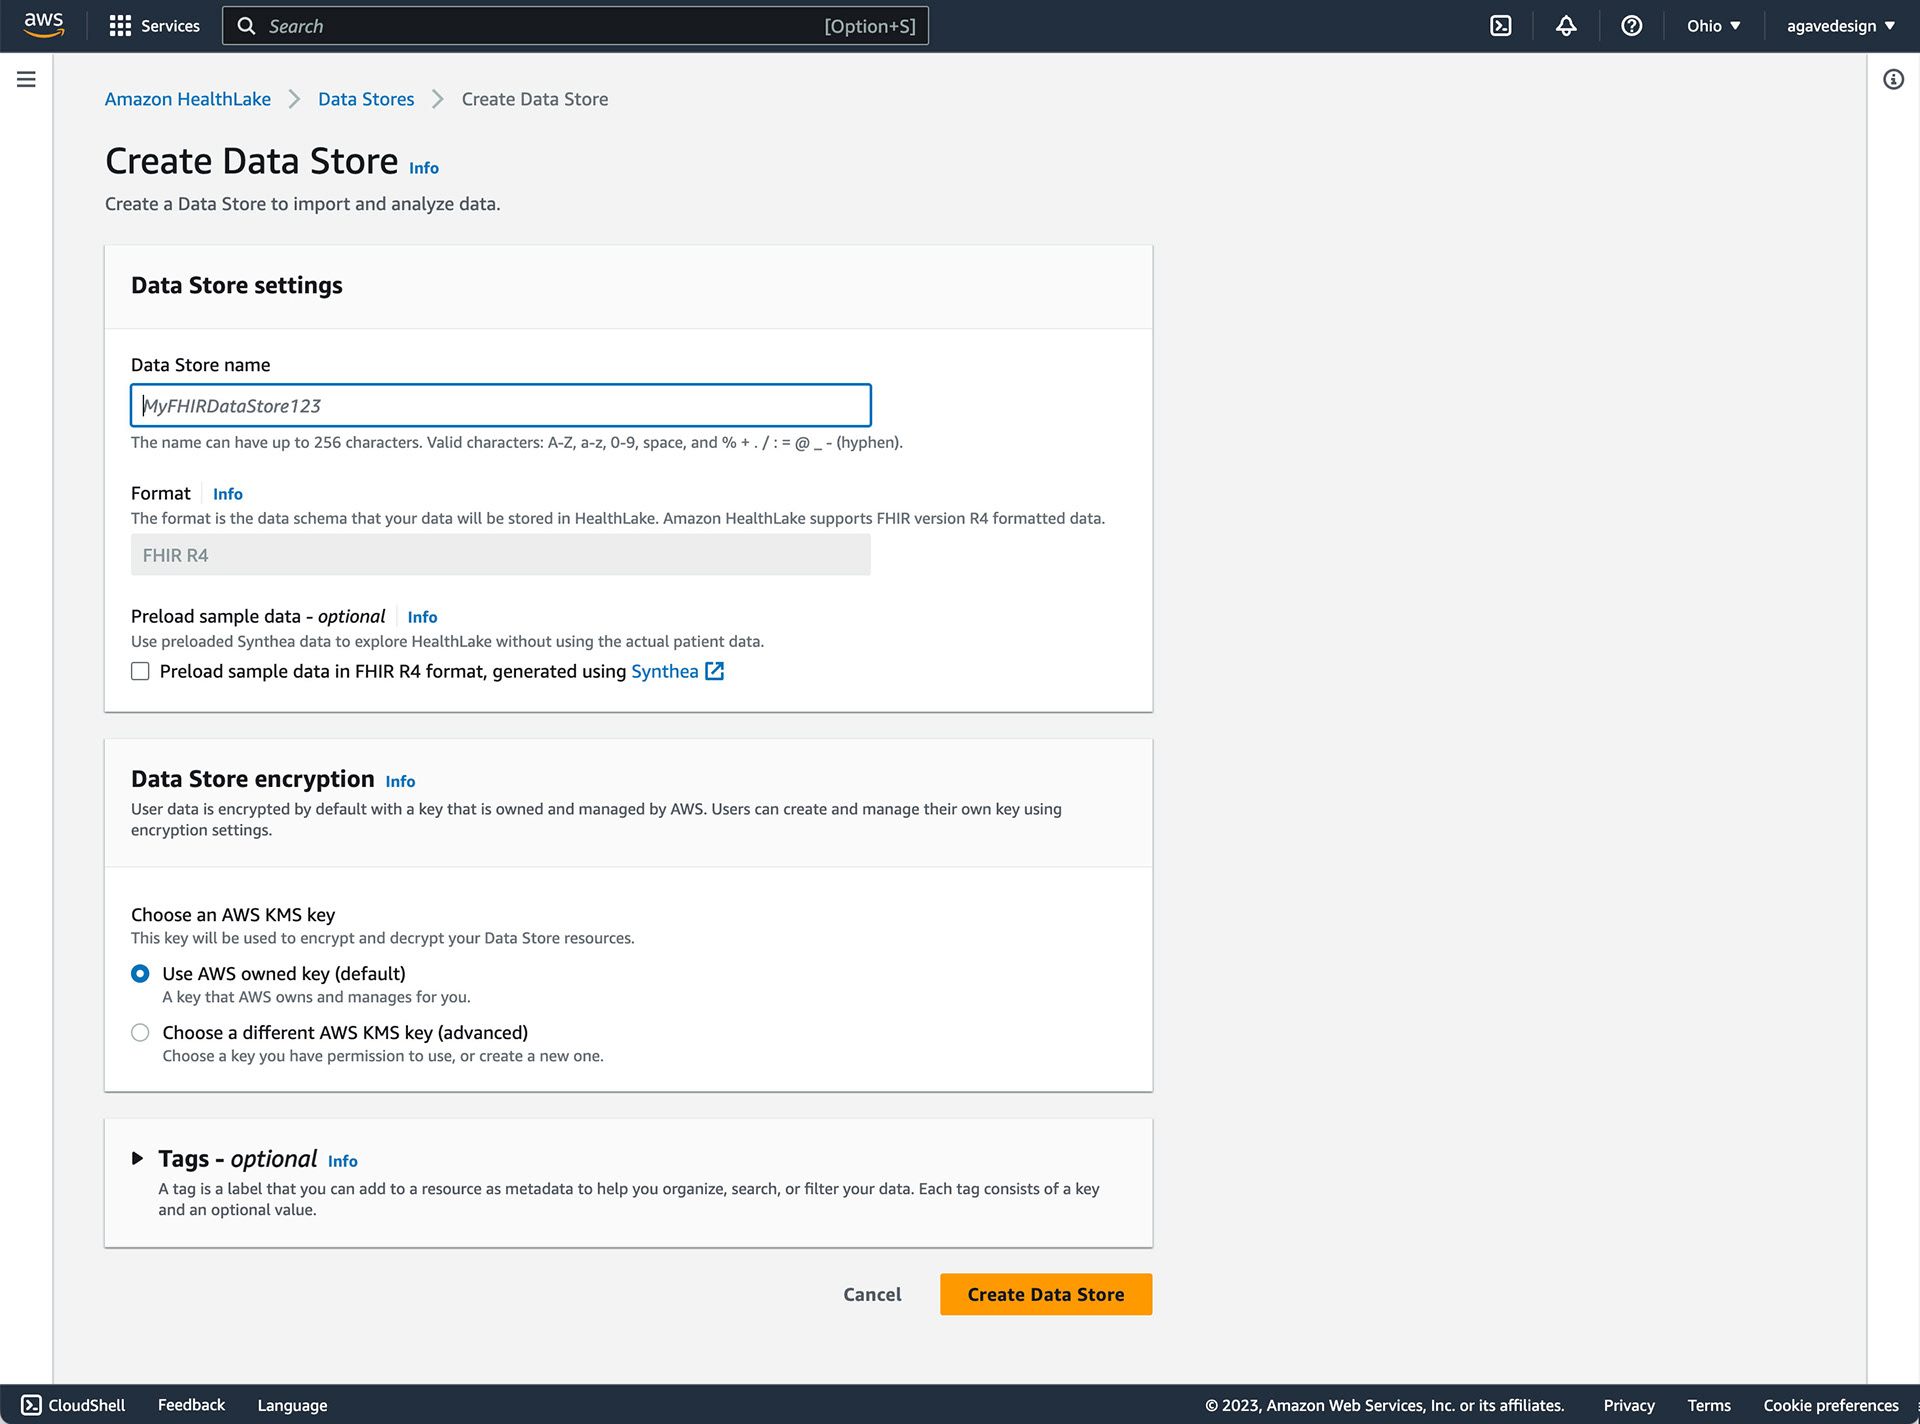
Data store creation form
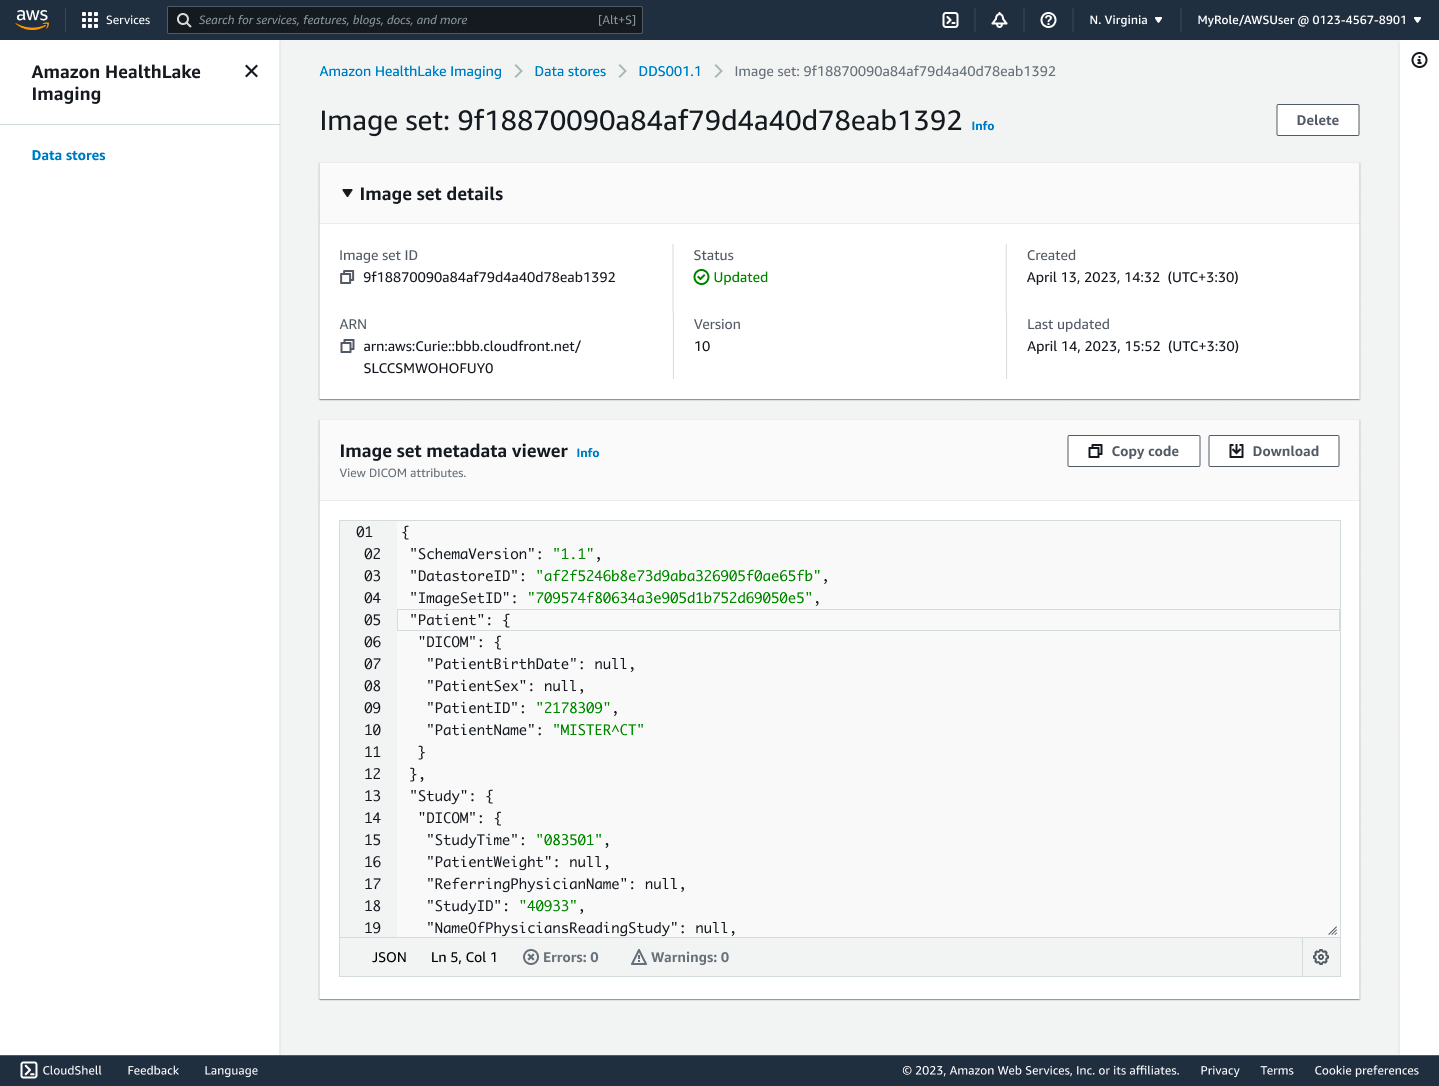
Image set details screen with metadata viewer
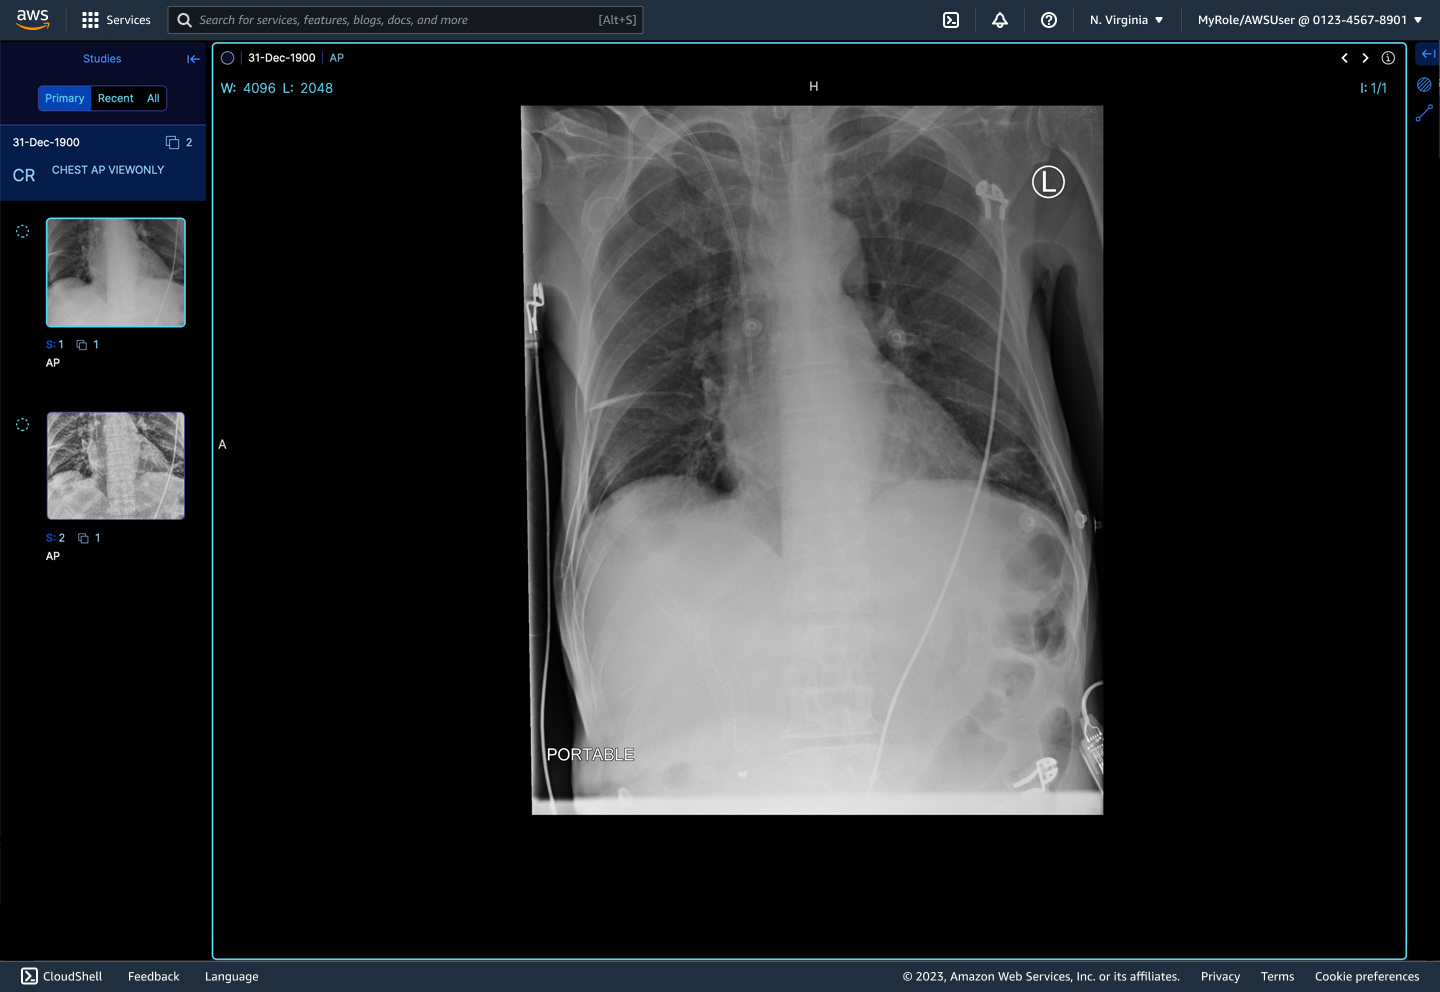
White-labeled DICOM data viewer